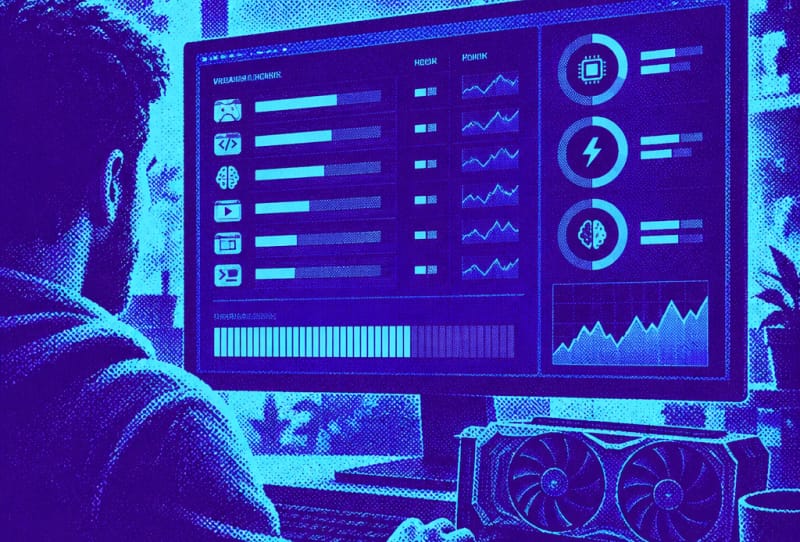
A new gputaskman GPU monitoring tool from Microsoft developer Scott Hanselman reveals exactly which applications are hogging a graphics card’s VRAM, power and compute resources in real time. Released as a free, open-source utility, gputaskman breaks down GPU activity on a per-process basis, something Windows Task Manager still does not do in any meaningful detail.
Key takeaways
- ✓Scott Hanselman, a Microsoft developer, has released gputaskman as a free open-source utility
- ✓It shows per-application VRAM usage, power draw, clock speeds, PCIe traffic and encoder activity
- ✓The tool can identify AI processes and report their model weights, quantisation and layer count
- ✓gputaskman works on Windows, Linux, WSL and Apple Silicon Macs with Nvidia and AMD support
- ✓Hanselman describes the project as experimental, with bugs and incomplete telemetry still expected
Hanselman, who works as a Microsoft developer and has a long history of building practical developer tools, published gputaskman as an experimental project rather than a polished commercial release. That distinction matters because the tool is still rough around the edges, but it already does something that plenty of PC users have wanted for years: a clear, app-by-app view of what is actually consuming graphics memory.
Table of Contents
What the gputaskman GPU monitoring tool actually shows
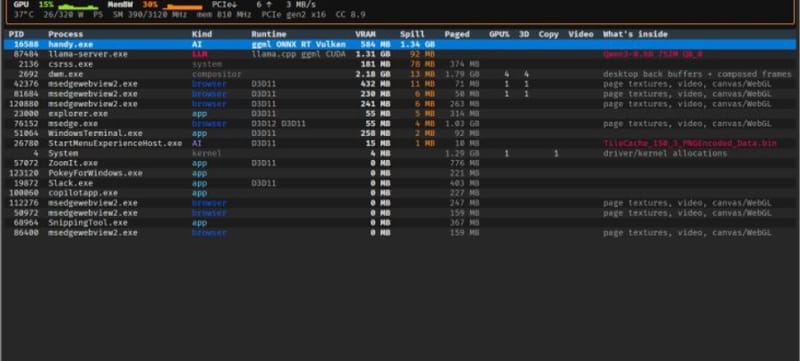
At its core, gputaskman gives a live readout of GPU behaviour for individual applications rather than the system-wide totals most monitoring software provides. That means a user can see precisely how much VRAM a game, a browser tab, or a background AI model is consuming, instead of guessing from one combined figure.
The tool surfaces several metrics per application, covering both traditional gaming workloads and the newer wave of local AI tasks running on consumer graphics cards. According to reporting from Tom’s Hardware, the breakdown includes the following.
| Metric | What it shows |
|---|---|
| VRAM usage | Memory allocated to each individual process |
| Power draw | Wattage consumed by a specific application |
| Clock speeds | Real-time GPU core and memory frequencies |
| PCIe traffic | Data flowing between the GPU and the rest of the system |
| Encoder activity | Video encode/decode engine usage, relevant for streaming and recording |
None of these figures are entirely new to GPU monitoring software on their own. What sets gputaskman apart is pulling them together into a single, per-process view that is otherwise buried or simply unavailable in the default Windows tools most people already have open.
Tracking local AI workloads specifically
Beyond gaming and general desktop use, gputaskman pays particular attention to local AI workloads, which have become a much bigger drain on consumer GPUs as more people run language models and image generators directly on their own hardware. The tool can identify when an AI process is active and report on its runtime, the model weights it has loaded, its quantisation format and its layer count.
That level of detail is useful for anyone experimenting with locally hosted AI tools, where VRAM headroom is often the single biggest bottleneck. Knowing exactly which model, and which version of that model, is sitting in memory can help users decide whether to switch to a smaller quantised model or close a workload entirely to free up memory for something else. This visibility becomes more valuable each year, particularly amid an ongoing GPU VRAM shortage driven by AI demand that has made every gigabyte of graphics memory count.
Platform support and how it compares to Task Manager
gputaskman currently runs on Windows, Linux, Windows Subsystem for Linux and Apple Silicon Macs. Support for Nvidia and AMD graphics cards varies depending on which platform it is running on, reflecting how differently each operating system exposes GPU telemetry to third-party software.
Windows Task Manager does include a GPU tab, but it only offers a shallow view of overall usage and a handful of general charts. It does not break down VRAM consumption by individual AI model, nor does it expose PCIe traffic or encoder load on a per-application basis. gputaskman is designed to fill exactly that gap, giving power users and developers the kind of granular telemetry normally reserved for dedicated GPU profiling software.
Hardware vendors have been moving in a similar direction too. AMD’s upcoming Zen 6 Medusa GPU architecture and Intel’s own push into dedicated AI-focused GPUs both point to a market where memory management and workload transparency matter as much as raw performance, which makes a tool like gputaskman arrive at a particularly relevant moment.
Why this matters for gamers and AI users
For gamers, the appeal is straightforward. Stuttering, texture pop-in and unexplained frame drops are often caused by a background application quietly eating into available VRAM. gputaskman offers a direct way to spot the culprit instead of closing programs one by one and hoping for an improvement.
For anyone running local AI models, the stakes are arguably higher, because VRAM limits often decide whether a model runs at all. Being able to see a model’s quantisation format and layer count alongside its memory footprint turns guesswork into an informed decision, which matters more as GPUs increasingly juggle games, creative software and AI inference at the same time.
Hanselman has been upfront that gputaskman remains experimental, and users should expect occasional bugs and incomplete telemetry on certain configurations. Even so, its release signals growing demand for better default GPU visibility, something operating system vendors have been slow to prioritise despite GPUs doing far more work than they used to.
Frequently asked questions
What is gputaskman?
gputaskman is a free, open-source utility built by Microsoft developer Scott Hanselman that shows detailed, per-application GPU statistics, including VRAM usage, power draw and AI workload details.
Which operating systems does gputaskman support?
The tool runs on Windows, Linux, Windows Subsystem for Linux and Apple Silicon Macs, with Nvidia and AMD graphics card support varying by platform.
Is gputaskman a finished product?
No. Hanselman describes it as an experimental project, meaning users should expect occasional bugs and incomplete data while it continues to develop.
How is gputaskman different from Windows Task Manager?
Task Manager only shows broad, system-wide GPU usage figures. gputaskman breaks activity down per application, including VRAM, power, clock speeds, PCIe traffic and AI model details that Task Manager does not expose.